
Graph Based Recommender
Course Project: Recommender System by Link Prediction using Algorithms
Importing necessary libraries
import networkx as nx
from networkx.algorithms.community.centrality import girvan_newman
from networkx.algorithms.community import kernighan_lin_bisection, louvain_communities
from networkx.algorithms.community.label_propagation import label_propagation_communities
import numpy as np
import pandas as pd
import matplotlib.pyplot as plt
from pylab import rcParams
Miscellaneous functions
def newColorHex():
    color = '#'
    for i in range(6):
        color += np.random.choice(list("6789ABCD"))
    return color
Reading CSV files containing relations between people and the products they bought
edgelist_df = pd.read_csv('data/relations.csv')
people_df = pd.read_csv('data/people.csv')
names = people_df.set_index('id').T.to_dict('list')
names = {k: v[0] for k, v in names.items()}


purchases = pd.read_csv('data/purchases.csv')
products = pd.read_csv('data/products.csv').set_index('id').T.to_dict()
product_names = {k: v['product'] for k, v in products.items() if k in purchases['product_id'].unique()}
product_prices = {k: int(v['price']) for k, v in products.items() if k in purchases['product_id'].unique()}
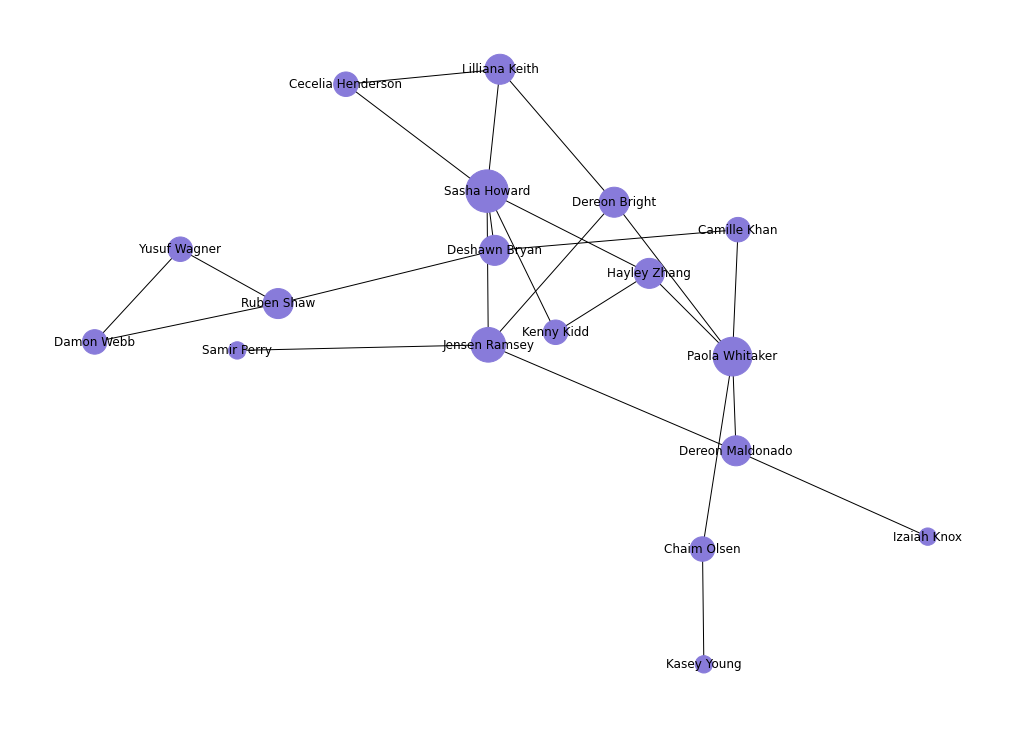
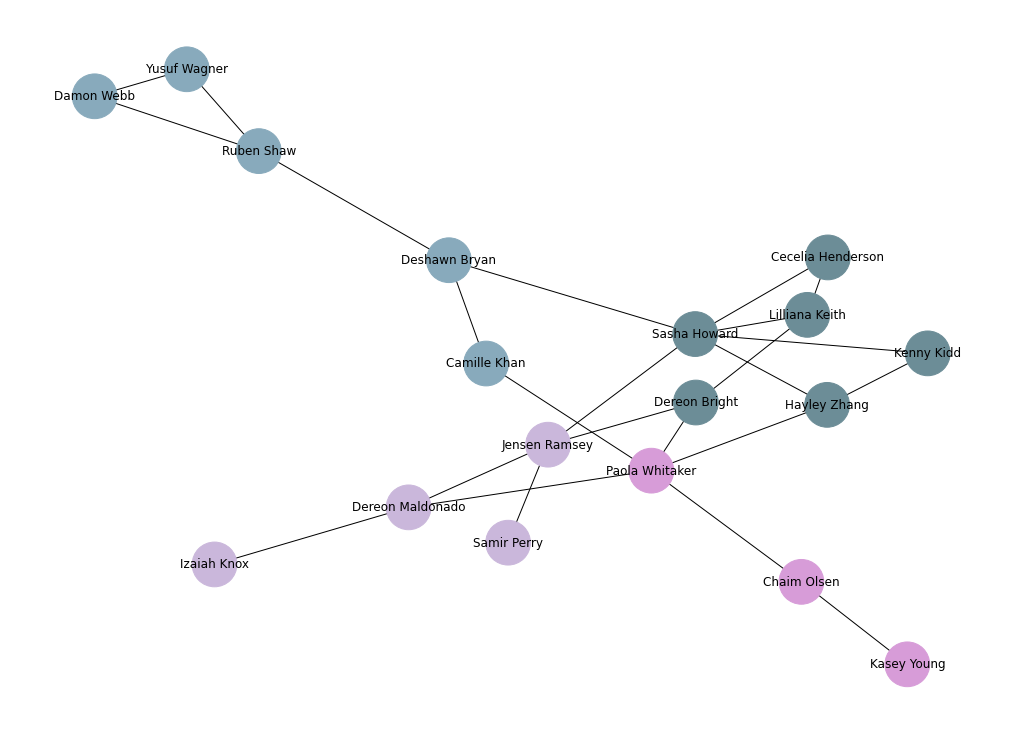
Plotting relations between people
G = nx.Graph()
G = nx.from_pandas_edgelist(edgelist_df, source='id1', target='id2')
G = nx.relabel_nodes(G, names)

rcParams['figure.figsize'] = 14, 10
pos = nx.spring_layout(G, scale=20, k=3/np.sqrt(G.order()))
d = dict(G.degree)
nx.draw(G, pos, node_color=newColorHex(),
        with_labels=True,
        nodelist=d,
        node_size=[d[k]*300 for k in d])
Finding communities
Partitioning the set of people via centraility measures (Girvan-Newman algorithm)
G = nx.Graph()
G = nx.from_pandas_edgelist(edgelist_df, source='id1', target='id2')
G = nx.relabel_nodes(G, names)

communities = girvan_newman(G)

node_groups = []
for com in next(communities):
    node_groups.append(set(com))

group_colors = [newColorHex() for _ in node_groups]

color_map = []
for node in G:
    for group_num in range(len(node_groups)):
        if node in node_groups[group_num]:
            color_map.append(group_colors[group_num])

plt.figure(5, figsize=(14, 10))
nx.draw(G, node_color=color_map, with_labels=True, node_size=2000)
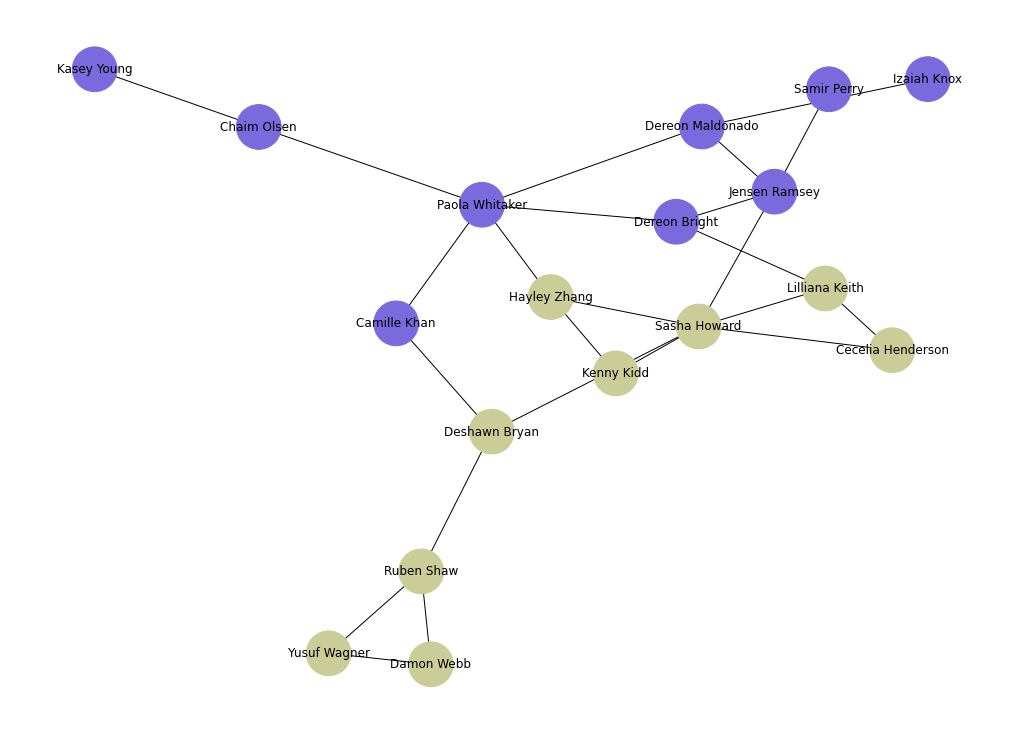
Finding bipartitions (Kernighan-Lin bipartition algorithm)
G = nx.Graph()
G = nx.from_pandas_edgelist(edgelist_df, source='id1', target='id2')
G = nx.relabel_nodes(G, names)

communities = kernighan_lin_bisection(G)

node_groups = []
for com in communities:
    node_groups.append(com)

group_colors = [newColorHex() for _ in node_groups]

color_map = []
for node in G:
    for group_num in range(len(node_groups)):
        if node in node_groups[group_num]:
            color_map.append(group_colors[group_num])

plt.figure(5, figsize=(14, 10))
nx.draw(G, node_color=color_map, with_labels=True, node_size=2000)
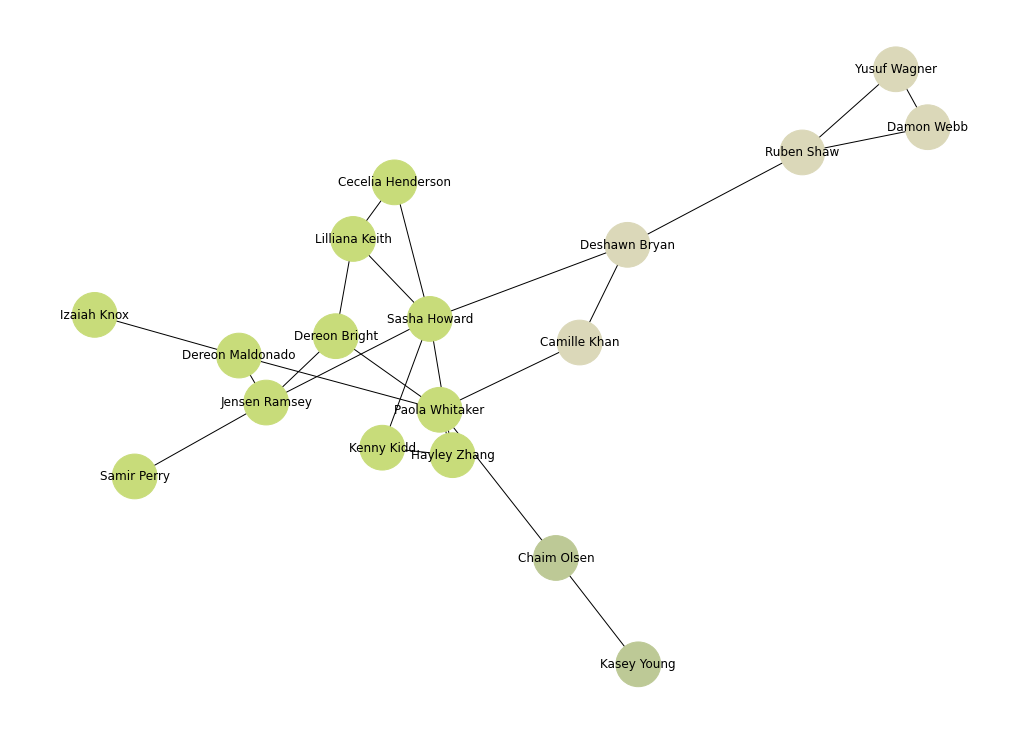
Finding communities using label propagation community detection algorithm
G = nx.Graph()
G = nx.from_pandas_edgelist(edgelist_df, source='id1', target='id2')
G = nx.relabel_nodes(G, names)

communities = label_propagation_communities(G)

node_groups = []
for com in communities:
    node_groups.append(com)

group_colors = [newColorHex() for _ in node_groups]

color_map = []
for node in G:
    for group_num in range(len(node_groups)):
        if node in node_groups[group_num]:
            color_map.append(group_colors[group_num])

plt.figure(5, figsize=(14, 10))
nx.draw(G, node_color=color_map, with_labels=True, node_size=2000)
Detecting communities using the Louvain community detection algorithm
G = nx.Graph()
G = nx.from_pandas_edgelist(edgelist_df, source='id1', target='id2')
G = nx.relabel_nodes(G, names)

communities = louvain_communities(G)

node_groups = []
for com in communities:
    node_groups.append(com)

group_colors = [newColorHex() for _ in node_groups]

color_map = []
for node in G:
    for group_num in range(len(node_groups)):
        if node in node_groups[group_num]:
            color_map.append(group_colors[group_num])

plt.figure(5, figsize=(14, 10))
nx.draw(G, node_color=color_map, with_labels=True, node_size=2000)
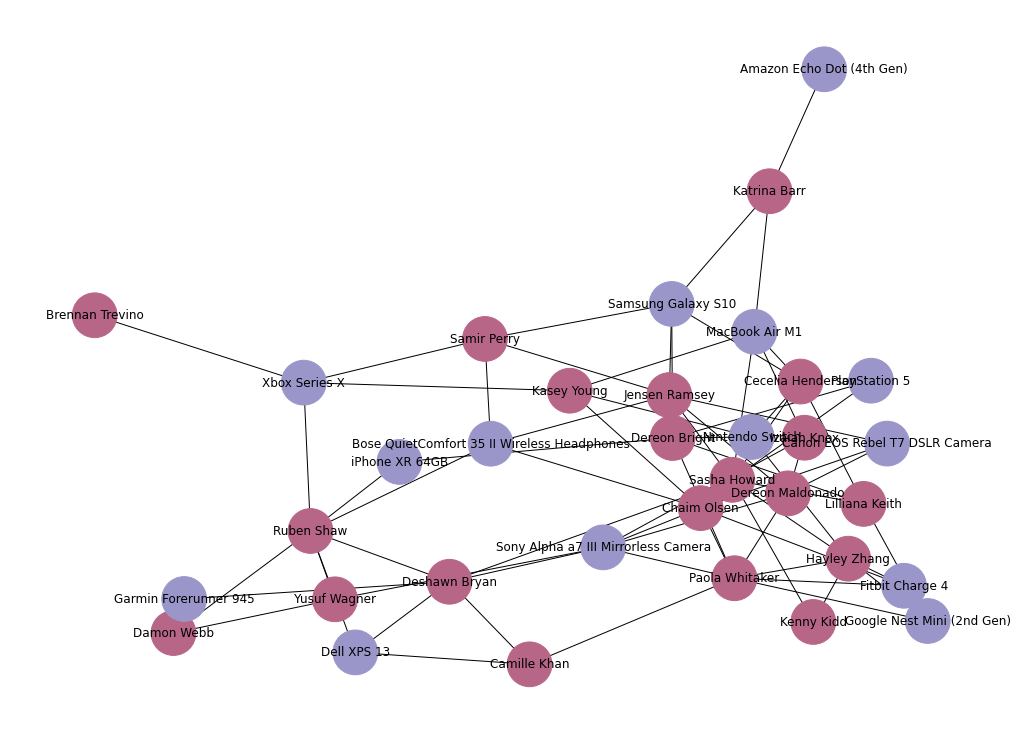
Plotting people and their purchases
G = nx.Graph()
G.add_edges_from(edgelist_df.values)
G.add_edges_from(purchases.values)

person_nodes = set(people_df.id.tolist())
product_nodes = set(purchases.product_id)

person_color = newColorHex()
product_color = newColorHex()

color_map = []
for node in G:
    if node in person_nodes:
        color_map.append(person_color)
    elif node in product_nodes:
        color_map.append(product_color)

G = nx.relabel_nodes(G, names)
G = nx.relabel_nodes(G, product_names)

plt.figure(5, figsize=(14, 10))
nx.draw(G, node_color=color_map, with_labels=True, node_size=2000)
Link Prediction using Algorithms
Using resource allocation index
G = nx.Graph()
G.add_edges_from(edgelist_df.values)
G.add_edges_from(purchases.values)

ebunch = []
for node1 in G:
    for node2 in G:
        if node1 != node2 and (node1, node2) not in G.edges and (node2, node1) not in G.edges:
            if node1 in person_nodes and node2 in product_nodes:
                ebunch.append((node1, node2))

iterator_list = list(nx.resource_allocation_index(G, ebunch=ebunch))
iterator_list_sorted = sorted(iterator_list, key=lambda x: x[2], reverse=True)
rai_predictions = list(map(lambda x: (names[x[0]], product_names[x[1]], x[2]), iterator_list_sorted))

df_predictions = pd.DataFrame(rai_predictions, columns=['person', 'product', 'resource_allocation_index'])
df_predictions
| person | product | resource_allocation_index | |
|---|---|---|---|
| 0 | Ruben Shaw | Sony Alpha a7 III Mirrorless Camera | 0.500000 |
| 1 | Sasha Howard | Google Nest Mini (2nd Gen) | 0.416667 |
| 2 | Dereon Bright | Google Nest Mini (2nd Gen) | 0.375000 |
| 3 | Paola Whitaker | Canon EOS Rebel T7 DSLR Camera | 0.366667 |
| 4 | Sasha Howard | Nintendo Switch | 0.366667 |
| ... | ... | ... | ... |
| 229 | Katrina Barr | iPhone XR 64GB | 0.000000 |
| 230 | Katrina Barr | PlayStation 5 | 0.000000 |
| 231 | Katrina Barr | Xbox Series X | 0.000000 |
| 232 | Katrina Barr | Dell XPS 13 | 0.000000 |
| 233 | Katrina Barr | Garmin Forerunner 945 | 0.000000 |
234 rows × 3 columns
Using Jaccard coefficient
G = nx.Graph()
G.add_edges_from(edgelist_df.values)
G.add_edges_from(purchases.values)

ebunch = []
for node1 in G:
    for node2 in G:
        if node1 != node2 and (node1, node2) not in G.edges and (node2, node1) not in G.edges:
            if node1 in person_nodes and node2 in product_nodes:
                ebunch.append((node1, node2))

jaccard_coefficients_list = list(nx.jaccard_coefficient(G, ebunch=ebunch))
jaccard_coefficients_sorted = sorted(jaccard_coefficients_list, key=lambda x: x[2], reverse=True)
jaccard_predictions = list(map(lambda x: (names[x[0]], product_names[x[1]], x[2]), jaccard_coefficients_sorted))

df_jaccard_predictions = pd.DataFrame(jaccard_predictions, columns=['person', 'product', 'jaccard_coefficient'])
df_jaccard_predictions
| person | product | jaccard_coefficient | |
|---|---|---|---|
| 0 | Lilliana Keith | PlayStation 5 | 0.500000 |
| 1 | Lilliana Keith | Nintendo Switch | 0.333333 |
| 2 | Camille Khan | Garmin Forerunner 945 | 0.333333 |
| 3 | Kenny Kidd | PlayStation 5 | 0.333333 |
| 4 | Damon Webb | iPhone XR 64GB | 0.333333 |
| ... | ... | ... | ... |
| 229 | Katrina Barr | iPhone XR 64GB | 0.000000 |
| 230 | Katrina Barr | PlayStation 5 | 0.000000 |
| 231 | Katrina Barr | Xbox Series X | 0.000000 |
| 232 | Katrina Barr | Dell XPS 13 | 0.000000 |
| 233 | Katrina Barr | Garmin Forerunner 945 | 0.000000 |
234 rows × 3 columns
Using Adamic-Adar index
G = nx.Graph()
G.add_edges_from(edgelist_df.values)
G.add_edges_from(purchases.values)

ebunch = []
for node1 in G:
    for node2 in G:
        if node1 != node2 and (node1, node2) not in G.edges and (node2, node1) not in G.edges:
            if node1 in person_nodes and node2 in product_nodes:
                ebunch.append((node1, node2))

iterator_list = list(nx.resource_allocation_index(G, ebunch=ebunch))
iterator_list_sorted = sorted(iterator_list, key=lambda x: x[2], reverse=True)
aai_predictions = list(map(lambda x: (names[x[0]], product_names[x[1]], x[2]), iterator_list_sorted))

df_predictions = pd.DataFrame(aai_predictions, columns=['person', 'product', 'adamic_adar_index'])
df_predictions
| person | product | adamic_adar_index | |
|---|---|---|---|
| 0 | Ruben Shaw | Sony Alpha a7 III Mirrorless Camera | 0.500000 |
| 1 | Sasha Howard | Google Nest Mini (2nd Gen) | 0.416667 |
| 2 | Dereon Bright | Google Nest Mini (2nd Gen) | 0.375000 |
| 3 | Paola Whitaker | Canon EOS Rebel T7 DSLR Camera | 0.366667 |
| 4 | Sasha Howard | Nintendo Switch | 0.366667 |
| ... | ... | ... | ... |
| 229 | Katrina Barr | iPhone XR 64GB | 0.000000 |
| 230 | Katrina Barr | PlayStation 5 | 0.000000 |
| 231 | Katrina Barr | Xbox Series X | 0.000000 |
| 232 | Katrina Barr | Dell XPS 13 | 0.000000 |
| 233 | Katrina Barr | Garmin Forerunner 945 | 0.000000 |
234 rows × 3 columns
Using common neighbour and centrality based parameterized algorithm score
G = nx.Graph()
G.add_edges_from(edgelist_df.values)
G.add_edges_from(purchases.values)

ebunch = []
for node1 in G:
    for node2 in G:
        if node1 != node2 and (node1, node2) not in G.edges and (node2, node1) not in G.edges:
            if node1 in person_nodes and node2 in product_nodes:
                ebunch.append((node1, node2))

iterator_list = list(nx.common_neighbor_centrality(G, ebunch=ebunch, alpha=0.8)) # default value alpha = 0.8
iterator_list_sorted = sorted(iterator_list, key=lambda x: x[2], reverse=True)
ccpa_predictions = list(map(lambda x: (names[x[0]], product_names[x[1]], x[2]), iterator_list_sorted))

df_predictions = pd.DataFrame(ccpa_predictions, columns=['person', 'product', 'ccpa_score'])
df_predictions
| person | product | ccpa_score | |
|---|---|---|---|
| 0 | Paola Whitaker | Nintendo Switch | 5.000000 |
| 1 | Paola Whitaker | Canon EOS Rebel T7 DSLR Camera | 5.000000 |
| 2 | Lilliana Keith | MacBook Air M1 | 5.000000 |
| 3 | Lilliana Keith | Nintendo Switch | 5.000000 |
| 4 | Lilliana Keith | Samsung Galaxy S10 | 5.000000 |
| ... | ... | ... | ... |
| 229 | Yusuf Wagner | Amazon Echo Dot (4th Gen) | 1.360000 |
| 230 | Brennan Trevino | Google Nest Mini (2nd Gen) | 1.360000 |
| 231 | Brennan Trevino | PlayStation 5 | 1.360000 |
| 232 | Brennan Trevino | Amazon Echo Dot (4th Gen) | 1.360000 |
| 233 | Damon Webb | Amazon Echo Dot (4th Gen) | 1.133333 |
234 rows × 3 columns>