Deep CNNs and Histogram Equalization for Glaucoma Detection
Using CNNs to classify an image into normal or glaucomatous, using retinal fundus images by transfer learning, and evaluating 2 histogram equalisation-based image preprocessing techniques. The dataset used is ACRIMA, containing 705 labelled images: 396 glaucomatous images and 309 normal images.
This project was a collaboration with H Shafeeq Ahmed. Our preprint is hosted on medRxiv here, you can also read it here.
Model Comparison
The CNN models were fit using 70% of the dataset for training, 10% for validation and 20% for testing.
The model architecture used is as follows:
- An input layer (256, 256, 3)
- A data augmentation layer
- The base model with image-net weights
- A flatten layer
- A dense layer with ReLU activation
- A 0.5 dropout layer
- A dense output layer with softmax activation
Data augmentation involved random change in contrast, flip along horizontal or vertical, rotation, and translation of the images:

The notebooks can be accessed in the notebooks folder folder of this repo. Here is an example of the notebook used for training a model based on VGG-19 using CLAHE for image preprocessing.
Results
| Model | Accuracy | Specificity | Sensitivity | F1 Score | Area Under ROC | Number of Parameters |
|---|---|---|---|---|---|---|
| VGG-16 | 0.9718 | 0.9516 | 0.9875 | 0.9753 | 0.9978 | 23104066 |
| VGG-19 | 0.9789 | 0.9677 | 0.9875 | 0.9814 | 0.9933 | 28413762 |
| ResNet-50 | 0.9577 | 0.9839 | 0.9375 | 0.9615 | 0.9956 | 57142914 |
| ResNet-152 | 0.9507 | 0.9839 | 0.925 | 0.9548 | 0.9944 | 91926146 |
| Inception v3 | 0.9085 | 0.8871 | 0.925 | 0.9193 | 0.9364 | 40677922 |
| Xception | 0.9296 | 0.9516 | 0.9125 | 0.9359 | 0.9794 | 54416682 |
| DenseNet-121 | 0.9577 | 0.9516 | 0.9625 | 0.9625 | 0.9960 | 23815490 |
| EfficientNetB7 | 0.9225 | 0.8871 | 0.95 | 0.9325 | 0.9625 | 106041497 |
Preprocessing Techniques Comparison
Two different preprocessing techniques were compared:
- Adaptive Histogram Equalisation
- Contrast-Limited Adaptive Histogram Equalisation
Results
I. Histogram Equalisation
| Model | Accuracy | Specificity | Sensitivity | F1 Score | Area Under ROC | Number of Parameters |
|---|---|---|---|---|---|---|
| VGG-16 | 0.943661972 | 0.935483871 | 0.95 | 0.95 | 0.993548387 | 23104066 |
| VGG-19 | 0.894366197 | 0.951612903 | 0.85 | 0.900662252 | 0.978427419 | 28413762 |
| ResNet-50 | 0.936619718 | 0.951612903 | 0.925 | 0.942675159 | 0.991935484 | 57142914 |
| ResNet-152 | 0.936619718 | 0.967741935 | 0.9125 | 0.941935484 | 0.98891129 | 91926146 |
| Inception v3 | 0.767605634 | 0.870967742 | 0.6875 | 0.769230769 | 0.846774194 | 40677922 |
| Xception | 0.767605634 | 0.903225806 | 0.6625 | 0.762589928 | 0.898387097 | 54416682 |
| DenseNet-121 | 0.929577465 | 0.887096774 | 0.9625 | 0.93902439 | 0.985080645 | 23815490 |
| EfficientNetB7 | 0.838028169 | 0.822580645 | 0.85 | 0.855345912 | 0.926814516 | 106041497 |
II. Contrast-Limited Adaptive Histogram Equalisation
| Model | Accuracy | Specificity | Sensitivity | F1 Score | Area Under ROC | Number of Parameters |
|---|---|---|---|---|---|---|
| VGG-16 | 0.922535211 | 1 | 0.8625 | 0.926174497 | 0.996572581 | 23104066 |
| VGG-19 | 0.922535211 | 1 | 0.8625 | 0.926174497 | 0.996572581 | 28413762 |
| ResNet-50 | 0.929577465 | 0.870967742 | 0.975 | 0.939759036 | 0.983770161 | 57142914 |
| ResNet-152 | 0.957746479 | 0.935483871 | 0.975 | 0.962962963 | 0.994153226 | 91926146 |
| Inception v3 | 0.809859155 | 0.774193548 | 0.8375 | 0.832298137 | 0.91733871 | 40677922 |
| Xception | 0.781690141 | 0.935483871 | 0.6625 | 0.773722628 | 0.921169355 | 54416682 |
| DenseNet-121 | 0.950704225 | 0.935483871 | 0.9625 | 0.956521739 | 0.987701613 | 23815490 |
| EfficientNetB7 | 0.894366197 | 0.838709677 | 0.9375 | 0.909090909 | 0.925604839 | 106041497 |
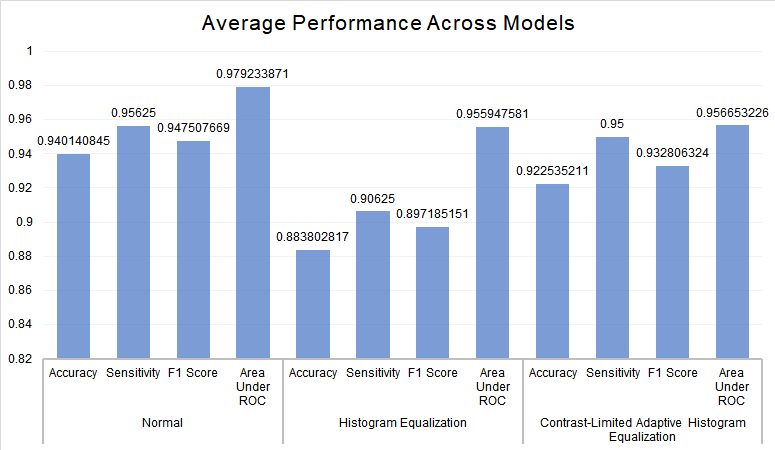
III. Comparing the Averages of Models